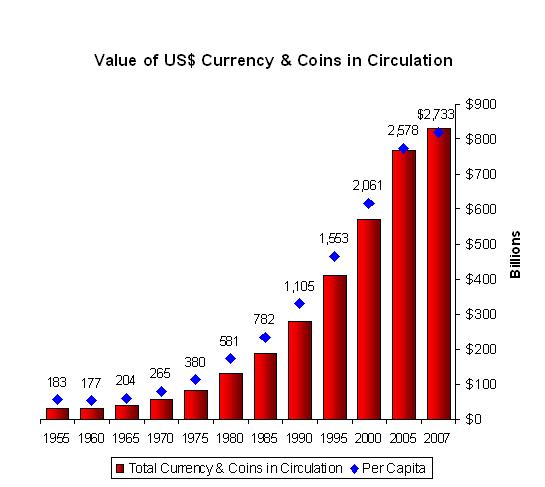
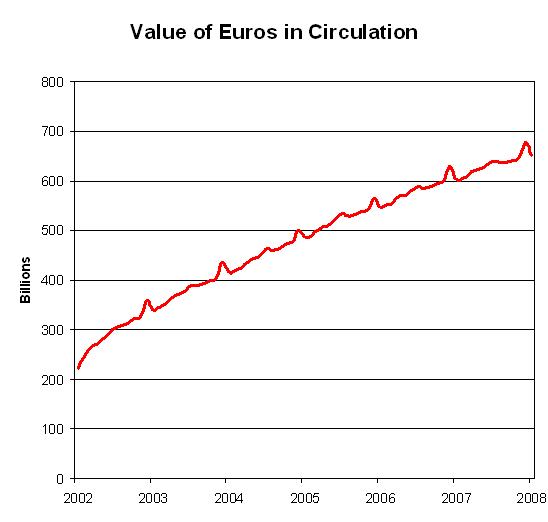
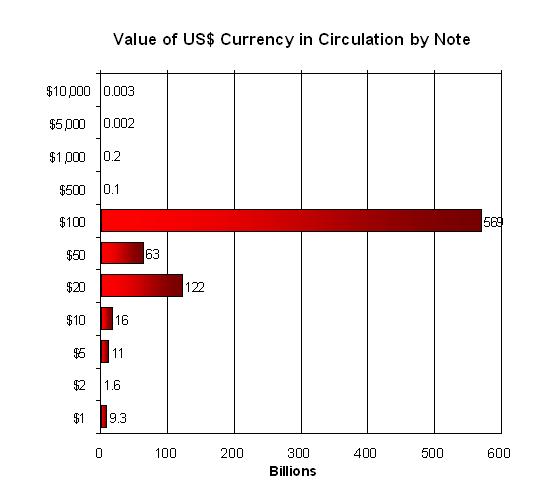
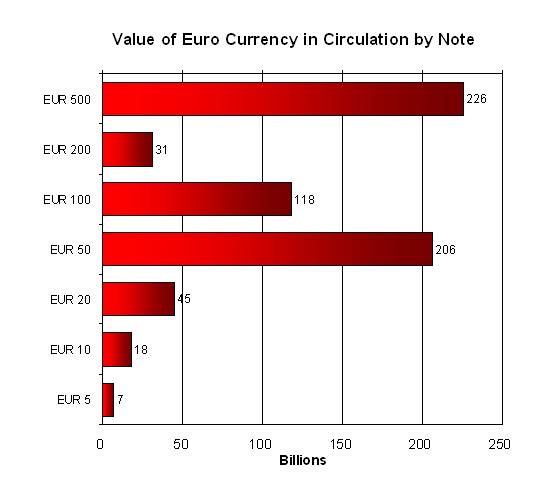
The value of the $US in circulation as currency has been increasing at an almost exponential rate. While the Euro has only been in existence since 2002, it’s short history has shown a more linear growth rate.
The value of the $US in circulation as currency has been increasing at an almost exponential rate. While the Euro has only been in existence since 2002, it’s short history has shown a more linear growth rate.
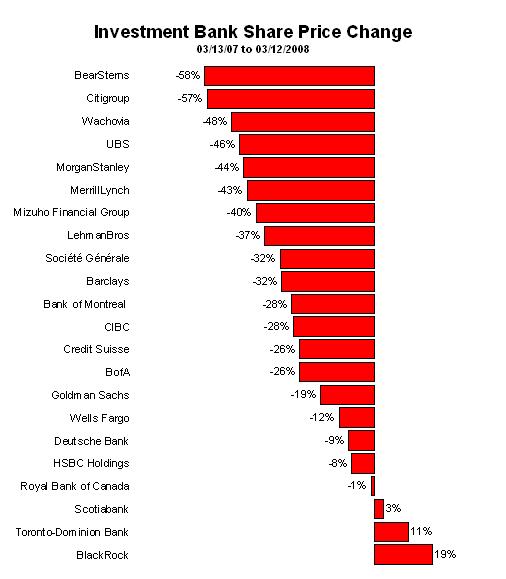
The CDO, MBS, SIV write-downs have taken their toll on the investment banking sector over the last year. As a proud Canadian, I am please to see our banks are fairing very well during the subprime storm. If I wasn’t so sure that the US government would rescue Citigroup, I would short it right down to its true value (zero).
Bird & Fortune on Subprime
This is THE BEST description of the subprime meltdown that I have seen. British humor at its best.
Career Builder - Corporate Monkeys
This ad is a funny take on how mangers are often so oblivious & unconcerned with the important, and how the rest of us are forced to play along or find a new job.
Microsoft CEO Steve Balmer - Developers Montage
Steve Balmer has been known to flip out at employee town hall meetings and other gatherings. This video montage is a compilation of his antics. It’s pretty funny to see him worked into a sweaty mess of a man.
Bill Hicks Corporate Schills Video Montage (strong language)
Bill Hicks was a legendary anti-establishment, anti-corporate comic before his untimely early passing in 1994. He was banned from David Letterman’s show for jokes that touch too close “establishment” interests. This video montage shows how so-called artists have sold out their reputations to corporate interests.
We’re all living in Amerika - Rammstein Video
This music video mocks America’s cultural & corporate takeover of the world. The moon landing set also mocks the 1969 moon landings as a fake Hollywood stunt (common belief in Europe and rest of world). Here is a translation of the lyrics.
This list is my choice of the top 5 charts I have happened across lately that are cause for great concern.
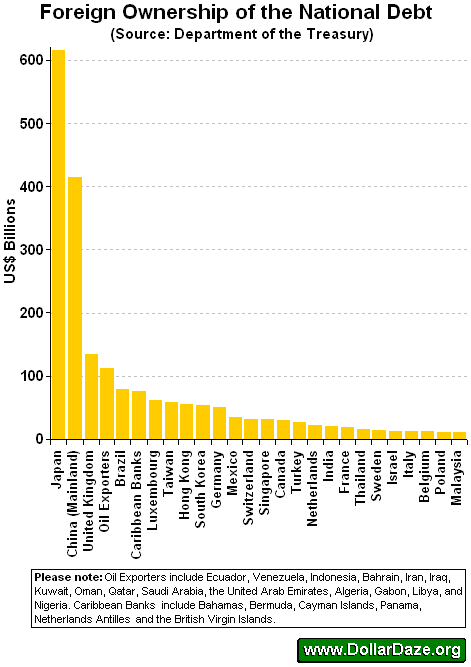
#1: The US Debt
Why is it a concern? Well, it’s rather obvious that the U.S. National Debt is growing by leaps and bounds and a large part of it is financed by foreigners. At some point repayment will become a concern. Of course, the inflation adjusted chart shows how the problem can also be inflated away, which appears to be the current strategy.
#2 Savings Rate

The chart clearly shows that there is now a negative savings rate. This is not sustainable long term. The only other time this happened was after the stock market crash of 1929. Are we also on the verge of a prolonged depression?
#3 Ajdustible Rate Mortgage (ARM) Resets

The chart shows that we are in for another major mortgage headache as the second wave of “Option ARMs” resets hits. For those that haven’t already heard, much of the current debt crisis is being caused by defaults on low rate mortgages resetting to higher interest rates. Option ARMs are often at such low initial rates that the principle balance grows until reset. Long story short, the subprime crisis is far from over.
#4 Oil Discoveries vs. Production Gap
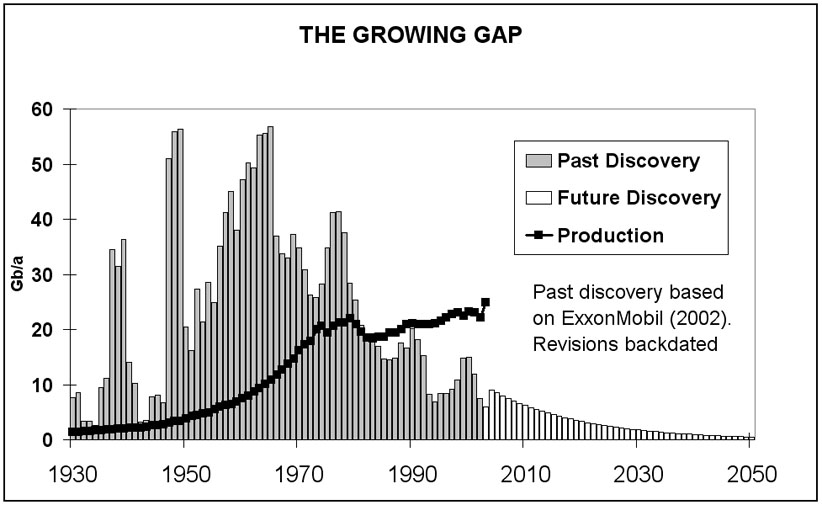
I chose this chart rather than the usual “peak oil” chart because I think it gets the same message across without trying to pick a peak year for oil production. At some point production will follow the historical discovery curve, and start to fall. Without a clear energy successor waiting in the wings, the world will be dramatically changed by this event.
#5 Real S&P 500 Performance

This chart shows that the S&P 500 lost ground against many other assets since 1999. Putting your money in gold bars and sitting on it for the last 9 years would have been the best investment you could have made. But that’s not what the talking heads on CNBC tell you, is it?
The following is a table of the world’s biggest banks by market capitalization in current U.S. dollar terms, showing their rank at the end of January 2008, 2007 and 2003.
1/31/08 Mkt cap ($bln) 1/31/07 1/31/03
1    ICBC                     277.514        4          NA
2    Bank of America          195.933        2          2
3    HSBC Holdings            176.788        3          3
4    China Construction       165.234        7          NA
5    Bank of China            165.087        6          NA

6    JPMorgan Chase           159.615        5          9
7    Citigroup                140.698        1          1
8    Wells Fargo              112.365        11         4
9    Banco Santander          109.862        12         23
10   Mitsubishi UFJ Financial 105.412        9          22

11   ABN Amro+                103.643        34         29
12   UniCredit                 97.591        15         32
13   Intesa SanPaolo           89.954        16         46
14   BNP Paribas               88.487        14         15
15   Goldman Sachs             87.602        18         18

16   UBS                       84.878        8          7
17   BBVA                      78.302        19         25
18   Sberbank                  77.713        31         109
19   Royal Bank of Scotland    76.023        10         6
20   Wachovia                  75.401        13         8

+ RBS, Santander and Fortis agreed to buy ABN Amro in 2007.
Source: Bloomberg.com


